Renewables provided over 90 per cent of the world's increase in generation capacity in 2024. That's because renewables are the cheapest sources
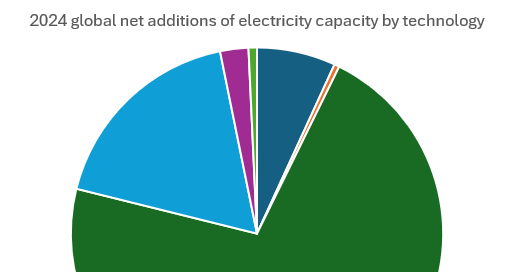
1Solar and wind power are dominating new generation capacity around the world. This is to such an extent that, according to data from the International Renewable Energy Association (IRENA), 90 percent of the net increase in global electricity generation capacity came from wind or solar and 93 percent from renewable energy as a whole. Solar PV provided the lion’s share of this increase, at 72 percent, with wind providing 18 percent, fossil fuels 7 percent, hydro 2 percent, bioenergy 1 percent, and nuclear power less than 0.5 percent. This is shown in Figure 1.
Please note that these are ‘net’ figures, that is new generation started in 2024 minus retirements from particular technology capacities. For example, in 2023 there was 1413 GW of solar PV capacity in the world. By the end of 2024, there was 1865 GW of solar capacity installed. This represents a net gain in generation of 432 GW. The net additions to global electricity capacity amounted to around 632 GW in 2024.
Figure 12
Source: IRENA - Renewable Energy Capacity Statistics 2025, see HERE
In Figure 2 we can see the position for new electricity generating capacity in 2009. This was earlier in what could be called the ‘renewable energy revolution’ when wind power was the leading renewable energy technology. It accounted for 18 percent of the increases in electricity generating capacity (the same as in 2024). The biggest difference was that in 2009 fossil fuels still provided the majority (58 percent) of capacity. Solar PV made a much smaller contribution (just 4 percent) compared to 2024, and hydro (at 15 percent) was rather more than 2024.
A record 117 GW of wind power was installed globally in 2024 (see HERE). Although wind power’s proportion of global generating capacity has not increased since 2009, the absolute quantity has. The fact that the proportion of wind power did not increase has a lot to do with the tremendous increase in the volume of solar PV deployed in 2024 compared to 2009.
Nuclear power provided 1 percent of increases in global capacity, very slightly more than in 2024. Then as now, there was supposed to be a ‘nuclear renaissance’. Yet in practice, this exists only on paper in the frequent and well-reported press releases that are produced by the nuclear industry and their ever-hopeful promoters.
Figure 2
What is significant is that these trends of dominance of the new generation are global. It is not a question of renewable energy being mostly restricted to a few western states who incentivise renewables, as tended to be the case until around 20 years ago. Now renewables have emerged as the cheapest source of power across the globe.
To listen to the self-styled ‘net zero sceptics’ in the UK, you would think that the advances towards near 100 percent ‘clean energy’ in the UK (as defined by the UK Government) were some aberrant woke nonsense dreamed up by Ed Miliband. Yet the IRENA figures suggest it is just reflective of a global trend. It is the ‘net zero sceptics’ who are the aberrant ones!
Capacity and generation
The proportions of new electricity generation (as opposed to capacity for generation) differ slightly from Figure 1. This is because the average capacity factors of the different technologies will differ between the technologies. Capacity factor is the proportion of power that a technology produces over a year compared to if it was generating at full capacity all of the time. Indeed, wind power’s energy generation position is a lot stronger than these ‘capacity’ figures imply. This is because the average capacity factor for wind power is more than double that of solar pv.
In order to account for this difference I have constructed a new Figure 3 which shows the approximate proportions of net gains (in 2024) in generation output (as opposed to capacity) of each technology. As can be seen, solar PV is the largest new generation source, providing 48 percent of the total. Wind power, at 30 percent of new generation is closer behind solar in generated electricity than the capacity data (as set out in Figure 1) would imply.
Fossil fuels are still well behind at 14 percent of generation with hydro and biofuels at 5 percent and 2 percent respectively. The total net renewable energy generation proportion of global new electricity production is 84 percent. Nuclear power is 2 percent of the net new generation, a figure that is less than half the actual increase in global electricity generation in 2024.
Figure 3
Sources of data: based on IRENA data in Figure 1 and capacity factors based on reviews of data from a range of sources, These include Statista, IPCC, Boston University Institute for Global Sustainability, and World Nuclear Association. Assumed capacity factors: Fossil fuels and bioenergy 50 per cent, hydro 44 per cent, wind power 39 per cent, solar PV 16 percent, nuclear power 80.5 per cent
Ember has reported that the proportion of electricity generated from renewables has risen to 32 percent in 2024. Nuclear’s share of 9 percent represents a decline to only a little over a half of its proportion of total world electricity generation in 2000 (see HERE) Given the overwhelming (and increasing) predominance of renewable energy capacity in the new generation we can expect the total proportion of electricity from renewables to carry on rising very quickly in the future.
Declines in costs of solar and wind power
However, this still leaves the question. How is it that this tremendous surge in solar and wind power is happening? The answer is based on something quite simple. In today’s world solar and wind power are the cheapest sources of power and markets are driving this trend.
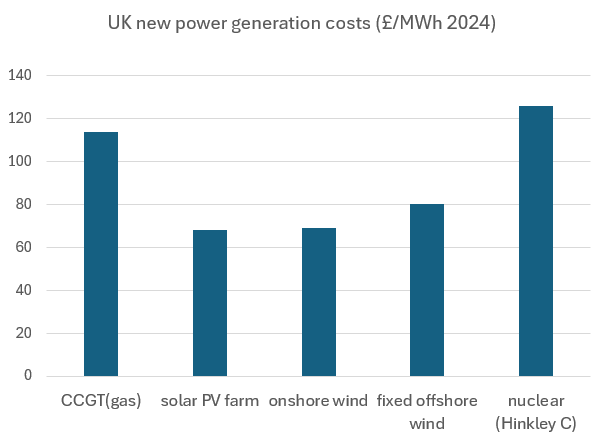
We can see this in the case of the UK where Figure 4 below contrasts the costs of main electricity supply options.
Figure 4
The figures for onshore and offshore wind and also solar farms are taken from the most recent auction round for contracts for difference (CfD) issued in September 2024 (AR6, see HERE). The figure for nuclear power is taken from the CfD issued for Hinkley C which was set at £92.50 in 2012 prices. This is uprated in 2024 price, as are the prices for the renewable energy sources, since all of these prices are stated by the UK Government in 2012 prices. The figures for gas power are taken from a Government report ‘Electricity Generation Costs 2023’, page 24 , see HERE.
It is very doubtful that gas fired power plant could be funded by CfDs at anything other than very high prices. This is because the increasing proportion of electricity supplied by renewables would mean that capacity factors for fossil fuel plants would be low. This would make their power very expensive. Gas peaking plants are now being incentivised through the ‘capacity mechanism’ organised by OFGEM. This incentivises capacity rather than energy production. Capacity (including batteries) is needed for balancing renewables.
No figures for electricity from coal are included here. but the costs will be higher than from gas. This is because capital costs of coal plants are much higher and conversion efficiencies (from coal to electricity) are lower compared to gas. Coal fuel costs are lower than gas, but this advantage is largely nullified by carbon prices. It should be noted that whilst some call for the abolition of carbon taxes, they are a source of tax revenue, implying that their abolition would require tax rises in other areas or public spending cuts. The prime purpose of carbon taxes, of course, is to promote climate protection.
The costs for Hinkley C do not include the effective subsidies put into the construction by the French Government via the state-owned EDF. These are in respect of the considerable construction cost overruns experienced during the project construction. The project is still a long way from completion.
This difficulty and high cost of building nuclear power is typical across the globe. This is even more the case in Western countries where relatively high wages are paid to engineering and construction workers. Productivity in construction has fallen relative to other sectors of the economy so making nuclear power projects much more expensive relative to solar wind wind energy projects. Notions that somehow nuclear power can be rescued by a turn to so-called ‘small modular reactors’ is a fantasy, as I discuss in an earlier post, see HERE
Figure 5 shows how prices for solar and wind energy technologies in the UK have fallen. In the last decade, there have been sharp declines in the CfD prices for onshore wind, (fixed) offshore wind, and solar PV. This is the UK part of a global context of steep declines in renewable energy costs.
There has been a tendency for half-truths and disinformation to be spread by self-styled ‘net zero sceptics’ to obscure the fact that there are tremendous declines in renewable energy costs in the UK. One tactic used by the obscurantists is to quote old prices paid for wind power and solar PV. Certainly, there are some legacy costs for the plant that (used to) need greater incentives for the technologies to develop. But these legacy costs are lapsing as far as the consumer is concerned and the current and future costs are heading downwards. The original high feed-in tariffs and contracts for difference were a great success in that they have helped create a market for developing technologies which have since declined greatly in price. The same process is likely to happen to floating wind farms which are currently enjoying higher levels of support.
Figure 5
Note: only prices for solar PV, onshore wind and fixed offshore wind are included. Source, UK Government see HERE and HERE, uprated to 2024 prices
These trends of rapidly declining costs of renewable energy are just part of a global trend. This is a trend that is revealed by the data discussed above on the domination of new capacity additions by wind and solar PV. The impression spread by the anti-renewable lobby that there is somehow a deviant leftish-green British obsession with wind and solar power is nonsense that is obviously exploded by the data, both globally and in the UK.
Projections about future costs
A paper published in Nature by Wiser et al (2021) (see HERE for paper) discussed the rapid declines in costs of wind power in the 2015-2020 period saying: ‘Wind energy has experienced accelerated cost reduction over the past five years—far greater than predicted in a 2015 expert elicitation. Here we report results from a new survey on wind costs, compare those with previous results, and discuss the accuracy of the earlier predictions. We show that experts in 2020 expect future onshore and offshore wind costs to decline 37–49% by 2050, resulting in costs 50% lower than predicted in 2015’ .
Wiser et al also commented that: ‘Increased turbine capacity can reduce CapEx and OpEx because fewer turbines must be installed and operated for a given amount of power production’. The trend towards wind power cost reductions was temporarily disrupted by the commodity price crisis of 2022. This increased the costs of metals that are crucial to wind turbine manufacture. Commodity prices have since fallen back again. Interest rates (whose increase also put up renewable energy costs) are also now subsiding. We can expect a downtrend trend in wind power costs to continue as predicted earlier.
However, it is the decline in costs of solar PV that has been especially dramatic. Solar panels are mass-produced in small units and are especially suitable for cost reduction through economies of scale in manufacturing. The cost reduction in these is widely said to follow ‘Wright’s Law’ which is variously said to mean a cost reduction of 20-25 percent with every doubling of production. Although I have not included data on them in this blog, the cost of batteries has also declined at a broadly similar rate to solar PV. Batteries become more important as the proportion of a grid’s supply of variable renewable increases.
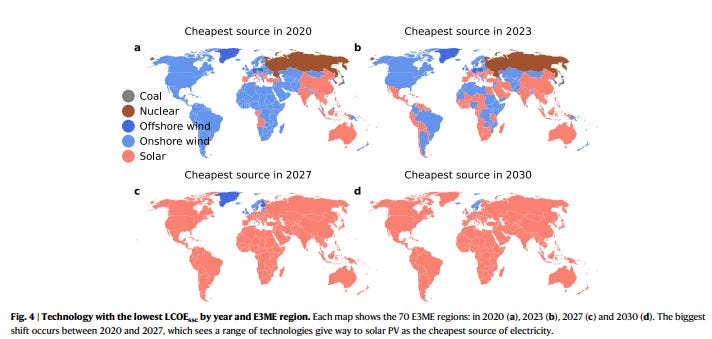
Figure 6 below shows a projection of the evolution of the costs of electricity generation technologies over the next few years. They project that solar PV becomes the cheapest power source across more and more of the planet. It achieves almost total global dominance by 2030 according to the projection. Indeed, according to the results of the UK’s CfD auction, solar farms already are the cheapest source of power.
However, before wind power supporters get too dismayed, being the cheapest source of electricity of all, does not mean that it is the only source that is economical for an electricity system. In the UK, solar PV may be the cheapest power source on average. However, British winters mean that wind power is needed to provide most power in the winter. Given the all-year-round appeal of wind power, wind is likely to be the biggest source of electricity supply (in terms of kWh delivered) for the foreseeable future. Even in many areas of the tropics, good wind farm sites can provide greater system resilience, especially at night time and times of less sunshine.
On the other hand, in tropical or sub-tropical areas we are heading towards a situation where solar PV will provide most of the electricity supply. Many parts of the world do not have a ‘winter’ problem, or at least not one that is as severe as in colder temperate or polar zones. Hence 24/7 supply will ultimately be mostly sourced from a mixture of solar PV plus batteries.
Figure 6
Source: F. Nijsse, J-F Mercure, N Ameli, F Larosa, S Kothari, J Rickman, P Vercoulen, H. Pollitt, (2023), ‘The momentum of the solar energy transition’, Nature Communications 14, Article number: 6542 , page 4 see HERE
Even when the costs of batteries are included with solar PV, as costed for Germany in Figure 7, solar farms (PV frei mit Batterie) remain much cheaper than fossil fuel or nuclear power. This trend will intensify in the future.
Figure 7
Source CHRISTOPH KOST PAUL MÜLLER JAEL SEPÚLVEDA SCHWEIGER VERENA FLURI JESSICA THOMSEN, (2024) ‘Stromgestehungskosten Erneuerbare Energien’, FRAUNHOFER-INSTITUT FÜR SOLARE ENERGIESYSTEME, page 18
Future demand
The rate of increase in renewable energy is encouraging but it needs to be quicker. Renewable energy needs markets that are created by substituting clean energy for fossil fuels. This will enable energy-efficient clean electric technologies to substitute for fossil fuels. World electricity is increasing as a proportion of total energy demand. Yet this rate of increase needs to be accelerated if renewable energy is to provide rapid decarbonisation. In 2024 world electricity demand increased by 4.4 percent according to the International Energy Agency. Yet this did not represent enough of a shift from fossil fuels to renewable energy. This was because a lot of the increase was due to an exceptionally hot summer, which boosted electricity demand through increased use of air conditioning (see HERE).
We can look forward to an increasing trend of a shift towards electrification in transport as EVs become cheaper and better through longer ranges. We can also see a drift towards greater use of heat pumps to provide heating in buildings. However, these trends, and also electrification of industrial activities need to be speeded up. Greater use of AI may help to encourage energy efficiency (as I discussed in an earlier post see HERE), but a greater political emphasis on electrification, and also on energy efficiency, needF to be greatly boosted.
Conclusion
Renewable energy led by solar PV and wind power dominates today’s new electricity generation. This process will intensify in future years as the costs of these technologies continue to decline. We need to dispute the posturing nonsense from net zero sceptics about the cost of renewable energy. The fact that the net zero sceptics are wrong should be obvious by even a glance at the global picture. Britain merely reflects these trends and is in no way an outlier. The only thing lacking is that decarbonsiation policies need to be speeded up, certainly not slowed down.
Thanks to Michael Taylor and David Milborrow for help in understanding recent trends in renewable energy costs
changes in other technologies, such as tidal power and geothermal energy, were too small to show up on this chart


Great synthesis of recent trends. 100% on board with the idea that while progress has been rapid, it needs to accelerate further yet. But at least the direction of travel is positive.
Thank you very much David for all your work which is very informative & shows how wrong the Fossil fuel advocated are such as Farage & his Ghastly Disinform group are funded by Fossil Fuel Co.s & would have many of us die in a hideous overheated future??