So how much of UK electricity could solar pv provide?
A lot more than people usually think...........
Even in not-always-sunny UK solar pv could provide up to 40 per-cent of annual electricity production. That is without a significant amount of curtailment of production or even the need to convert the electricity into stored energy such as hydrogen. Of course this is dependent on there being enough provision of batteries. Solar plus batteries will be the dominant energy system in the world in future decades, but they will also be centrally important in UK.
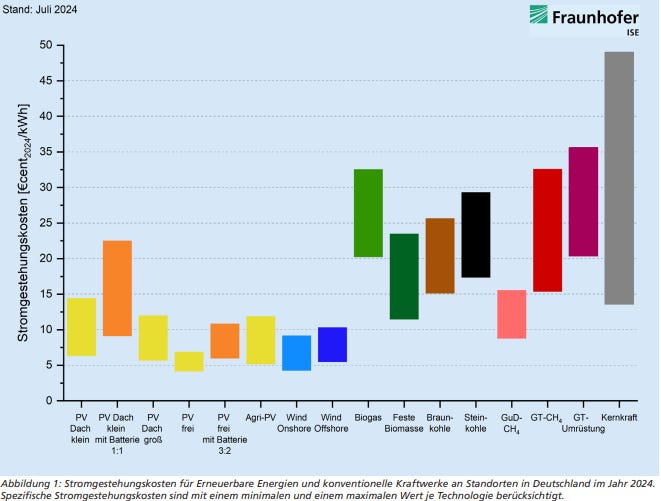
In the past it used to be said that solar plus batteries was hellishly expensive - and indeed twenty years ago this was definitely true. But no longer! Indeed the Fraunhofer Research Institute have produced a report which says that solar-plus-batteries is cheaper than conventional power plant including gas and coal and roughly on par with offshore wind. This can be seen in the chart below. Note the ‘PV frei mit Batterie’ which refers to solar farms with batteries.
Chart 1
Source CHRISTOPH KOST PAUL MÜLLER JAEL SEPÚLVEDA SCHWEIGER VERENA FLURI JESSICA THOMSEN, (2024) ‘Stromgestehungskosten Erneuerbare Energien’, FRAUNHOFER-INSTITUT FÜR SOLARE ENERGIESYSTEME, page 18
However, both solar pv and batteries are getting cheaper and cheaper. Analyst Auke Hoekstra (see HERE) comments that:
‘For almost a century we were complacently using lead acid batteries, until laptops and PCs forced us to develop something better. In 2008 batteries were over $1500/kWh but now NMC battery cells (lithium batteries with a cathode from nickel, manganese and cobalt) can be bought for less than $100/kWh and the somewhat heavier lithium iron phosphate cells that are better in every way than those first cells can be had for just $47/kWh’
This process of price reduction is carrying on and on. Hoekstra quotes so-called ‘Wright’s Law’ which says that every doubling of production of a technology reduces costs by 25%. Now with batteries (and solar pv) there’s a lot more cycles of doubling production of the technologies to go, so prices will carry on crashing!
Hoekstra says ‘I predict that long before 2030 we will have long lasting batteries for less than $50/kWh everywhere’ and predicts: ‘stationary batteries in your house and everywhere will turn the stormy electricity grid into a calm swimming pool’.
We can see how this works by looking at annual and daily flows of electricity demand and how this relates to changing wind and solar outputs.
Solar pv is problematic from a grid integration point of view because so much is produced in the summer compared to winter. You can see this from Chart 2 which shows the proportions of annual electricity demand, wind production and solar pv generation according to each month of consumption or production. The chart below was constructed by taking an average of data from NGESO covering the years 2021, 2022 and 2023.
Chart 2
As can be seen in the chart (using data from NGESO) electricity demand is higher in winter (eg more lighting needed) than summer, although because little heating is currently done by electricity the seasonal difference is not as great as may be guessed. There are substantial differences in wind output between seasons, with around 63 per cent generated in winter, and 37 % in the six summer months (April-September inclusive). There is an even greater difference in solar production. Around 75% is generated during the summer months compared to 25% in winter. Hence, as the proportion of electricity generated from solar pv rises, so, without more batteries, the chances of there being excess solar, and negative prices in the wholesale power markets, increase. This is a summer problem for solar!
See below a chart for one of the sunniest days of 2023, on May 15th 2023 - and when there is typical electricity demand.
Chart 3
The x-axis on the chart covers the 48 half hour trading units in the day. The y-axis is MW of electricity. A note on the data in the chart - the NGESO data used for electricity demand and solar generation (expressed as MW per half hour) do not capture all of it because a) some electricity is produced and consumed at the local or ‘distributed’ level b) around 9 percent of solar generation counted by the NGESO data is absorbed by ‘prosumers who have solar pv and consume some of the solar output themselves.
As you can see there’s not much of a problem in absorbing solar pv into national electricity demand at the moment (barring grid constraints). However. as solar pv builds up towards Government targets there will be more of an issue when wind power and solar power combine more often to exceed electricity demand. In 2023, according to Government data, 4.7 percent of UK electricity production came from solar pv.
Now I’ll move onto to look at what happens when solar generation is increased by a factor of 8 in the context of electricity demand for 2023. See Chart 4.
Chart 4
Again, as in the previous chart, the x-axis covers the 48 hours of the day May 15th 2023 assuming that solar generation grew to 8 times its present size. This would imply that solar generation increased from over 15 GW in 2023 to over 120 GW. This is rather more than the Government target of 70 GW by 2035. But then the Government is assuming electricity demand will have greatly increased by then to absorb the solar generation.
Obviously, though, at 2023 levels of electricity demand there is considerable excess solar production on this day from around 8.30 in the morning to nearly 6pm at night. This would produce one hell of what is called a ‘duck curve’ where the need for non-solar generation drops (in this case to highly negative proportions) during large parts of the day.
But an effective battery deployment programme will (or at least should) sort this out in the future. Imagine a system where we could have a battery system where a lot of the batteries had a day-long duration. (Note: duration is used here in its commercial sense as the amount of time it will take to generate the power rating of the battery). It is not economic to have many day-long duration batteries at the moment (most commercial battery durations are no longer than 4 hours). However, if there is the demand for this, then it could happen, or something close at least. Then the situation could be dramatically different, and all of the solar could be absorbed into the system, without any curtailment or even conversion to hydrogen etc.
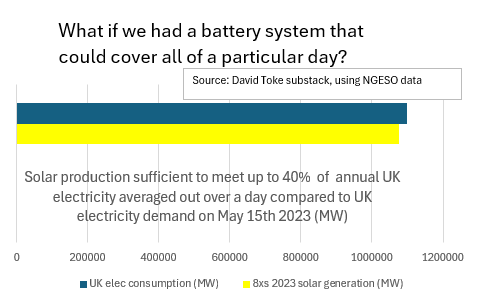
Look at this chart which compares total electricity demand in May 15th 2023 with solar pv generated at eight times the volume than was the case then.
Chart 5
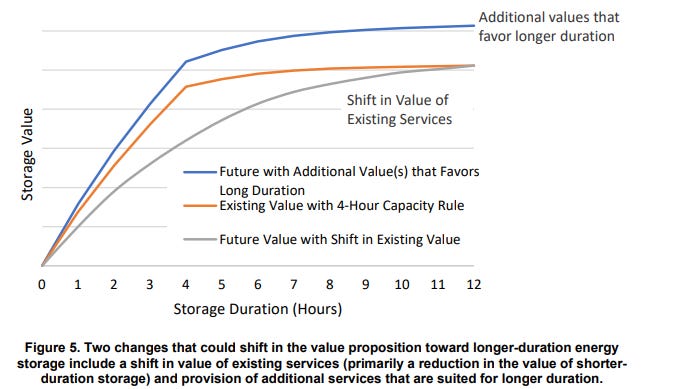
As you can see total solar generation for that day is less than total electricity demand for the day. So long as there is enough battery capacities with sufficient (up to a days worth) duration then all of the solar generation could be absorbed into the grid without curtailment or any other means of storage. Day-long battery duration will take a long time to come into large-scale commercial operation in the UK. However half-day-duration battery deployment (which will achieve the large bulk of the effect as day-long duration) is not as far away from the commercial horizon. This will become more of an economic proposition as battery costs decline and variable power outputs increase. See for instance the Figure published by authors based at the US National Renewable Energy Laboratory (NREL).
Chart 6
Source: Moving Beyond 4-Hour Li-Ion Batteries: Challenges and Opportunities for Long(er)-Duration Energy Storage Paul Denholm, Wesley Cole, and Nate Blair National Renewable Energy Laboratory (September 2023) page 11 https://www.nrel.gov/docs/fy23osti/85878.pdf
Indeed the authors comment (on page 11) that ‘It is important to note that we are considering changes that will occur in the relatively near term, as opposed to changes that will occur associated with extremely large-scale deployment of renewables and deep decarbonization’. See HERE
But what about all of the wind power being generated?
I imagine most of you will be thinking that talking about solar generating 40 per cent of UK electricity without curtailment is all very well, but surely you have to fit all the wind power into the system as well. Yes, of course you are right, but the problem is rather less than one might assume because there is a certain degree of complementarity between wind and solar production. You can see this in Chart 2 where there is much more wind power generated in winter compared to summer. above. Conventional power plant can be temporarily closed down to make way for wind and solar, although making this happen with nuclear power is a different matter.
In a system for 100 per cent renewable energy, such as that modelled by LUT University for 100percentreneweableuk (see HERE), solar pv could provide around thirty per cent of electricity supply. However, some of that would be used to generate efuels for storage and industrial purposes. Some renewable energy could also be exported through electricity interconnections.
From my calculations using the NGESO numbers, I can see that even with a 100 per cent renewables system relying on just variable sources, then at least 20 percent of annual generation can come from solar pv without much curtailment.
One would need to engage in rather more complex modeling to assess the degree to which the whole system could be run pretty much only using wind and solar. However it does seem that as commercially economic battery duration get longer it should be possible to secure the large bulk of electricity from variable renewables without curtailment. The rest of the electricity would be provided by (mainly wind and solar) plant which would could not generate to the grid all of the time. Instead they would be available to provide green hydrogen and efuels for use in industrial and long term storage markets. This would be the gas that would power small or large power plant to provide balancing.
A further issue, which I haven’t touched on here is that grid constraints reduce the ability of fluctuating renewable energy to be absorbed on the grid. We need more grid investment! However this is a much bigger problem with wind power (especially in Scotland) than it is with solar pv. On the other hand, I have not touched upon demand-side flexibility, which is another important way of absorbing fluctuating renewables into the system. It needs its own discussion, but without saying any more, it is very important and it will itself reduce the need for curtailment of renewable energy generation.
But if you want to know how much solar pv could provide to UK energy, its a lot more than you think!
The need for a battery strategy
Widespread deployment of batteries are needed to help absorb variable wind and solar generation - especially in the case of solar pv. Otherwise the value of variable renewable energy on wholesale power markets will decline at peak generation periods, and the periods of negative pricing will become more frequent and longer. This is especially true of solar pv. I am seeing analysts declaring that in some countries, for instance, Spain, there is already a problem of excess solar production. But I think people are looking at the problem the wrong way around. There are simply not enough batteries being deployed, and this can be changed!
We cannot expect markets to deliver the amount that would optimise the system because the markets for batteries and the electricity markets are separate. Electricity markets are based on the needs of individual consumers, but the need for batteries is felt most of all at the system level. California has been dealing with the so-called ‘duck curve’ now for some time. But rather than just letting a lot of analysts whinge on about duck curves and so-called price cannibalisation (without urging solutions), California is getting a lot more batteries developed. They have a structure to plan the energy transition, for instance through the California Energy Commission. That’s something the UK should have! Most of all we need incentives and regulations that will get the battery job done.
PS Thanks to my wife Yvonne in helping me analyse some of NGESO’s spreadsheets


I agree in general, but there are a few minor points where I feel more discussion is potentially useful. On the other hand, as an American you have to shoot me to make me shut up so maybe those feelings are wrong.
1) Your quoted "25% cost reduction per doubling" is very aggressive- I don't know a specific number for batteries but most of what I've seen is 15-20% (18% for solar, from memory.) Maybe batteries are really doing that well; good news if true. It's a 50% difference in price for 16x growth, which may not be a major difference.
2) I tend to think in terms of "4 Wh of battery for every W of new solar" which, very approximately, makes that solar dispatchable over the day. Also, VERY approximately, doubles the cost of the system (as both are falling ~20% per year, this is really imprecise.) Maybe less so for a sunny English summer day. 12 hours of battery for me is kind of a valley-of-death unless we get a new technology that's "kinda slow to charge and discharge" but really cheap. I hope Noon Energy or Form Energy get their 100+ hour systems going, which makes wind dispatchable, but I understand if you can't assume new technologies will save us. Also, Form Energy has a model which claims that 100 hours gets rid of most of the dunkelflaute problem but I haven't checked their model.
3) Solar panels are so dang cheap that weird things like "Put two sets at steep angles back to back, one east one west, sharing an inverter" make more sense than you'd expect. This lets you get more morning and evening power, taking some stress off your batteries. (In PV-Watts, for London, I got about 25% more power than due south, but that wasn't exactly peer reviewed work.) Current wholesale panel prices are around US$0.07/W .
Could this lead to a shift from an AC to a DC transmission system?